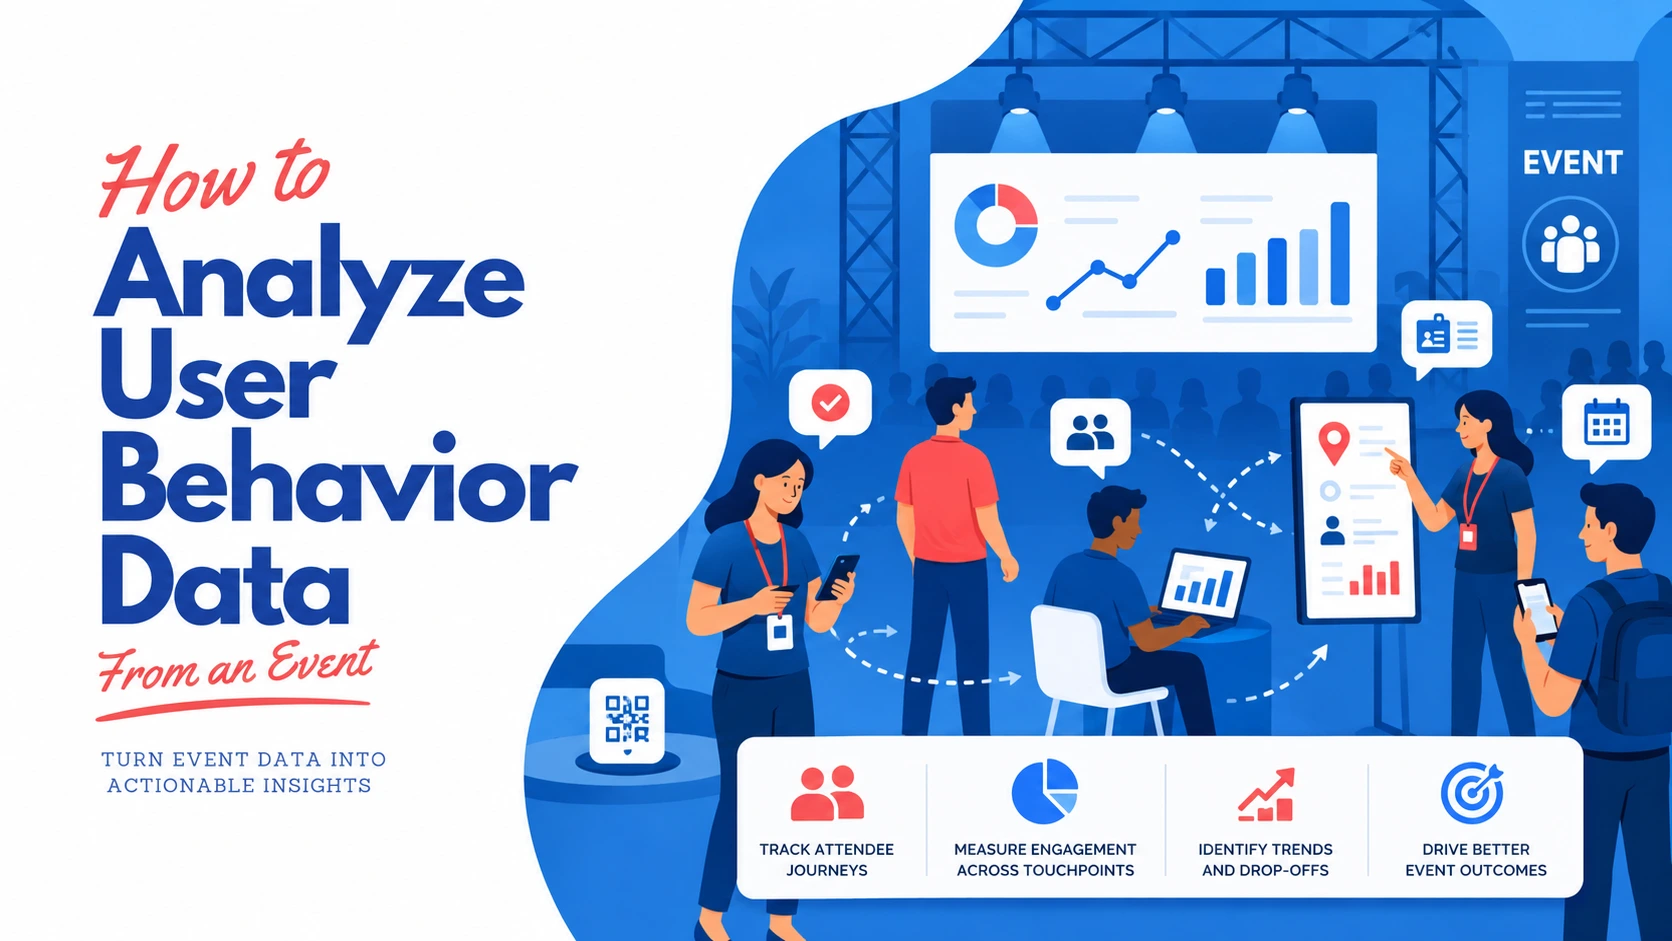
Key Takeaways: User behavior data from an event is the trail attendees leave during the event. This includes how they register, show up, engage, and follow up, not what they said they would do. Analysis turns that trail into decisions: what to repeat, what to cut, and exactly where people drop off. Start with one question, centralize the data, segment your audience, then map the full attendee journey. Each event type has one or two signals that matter most. A webinar lives on show rate, a trade show on qualified lead scans.
Ticket Generator captures registration, check-in, and conversion data in one dashboard, exportable to Excel or PDF.
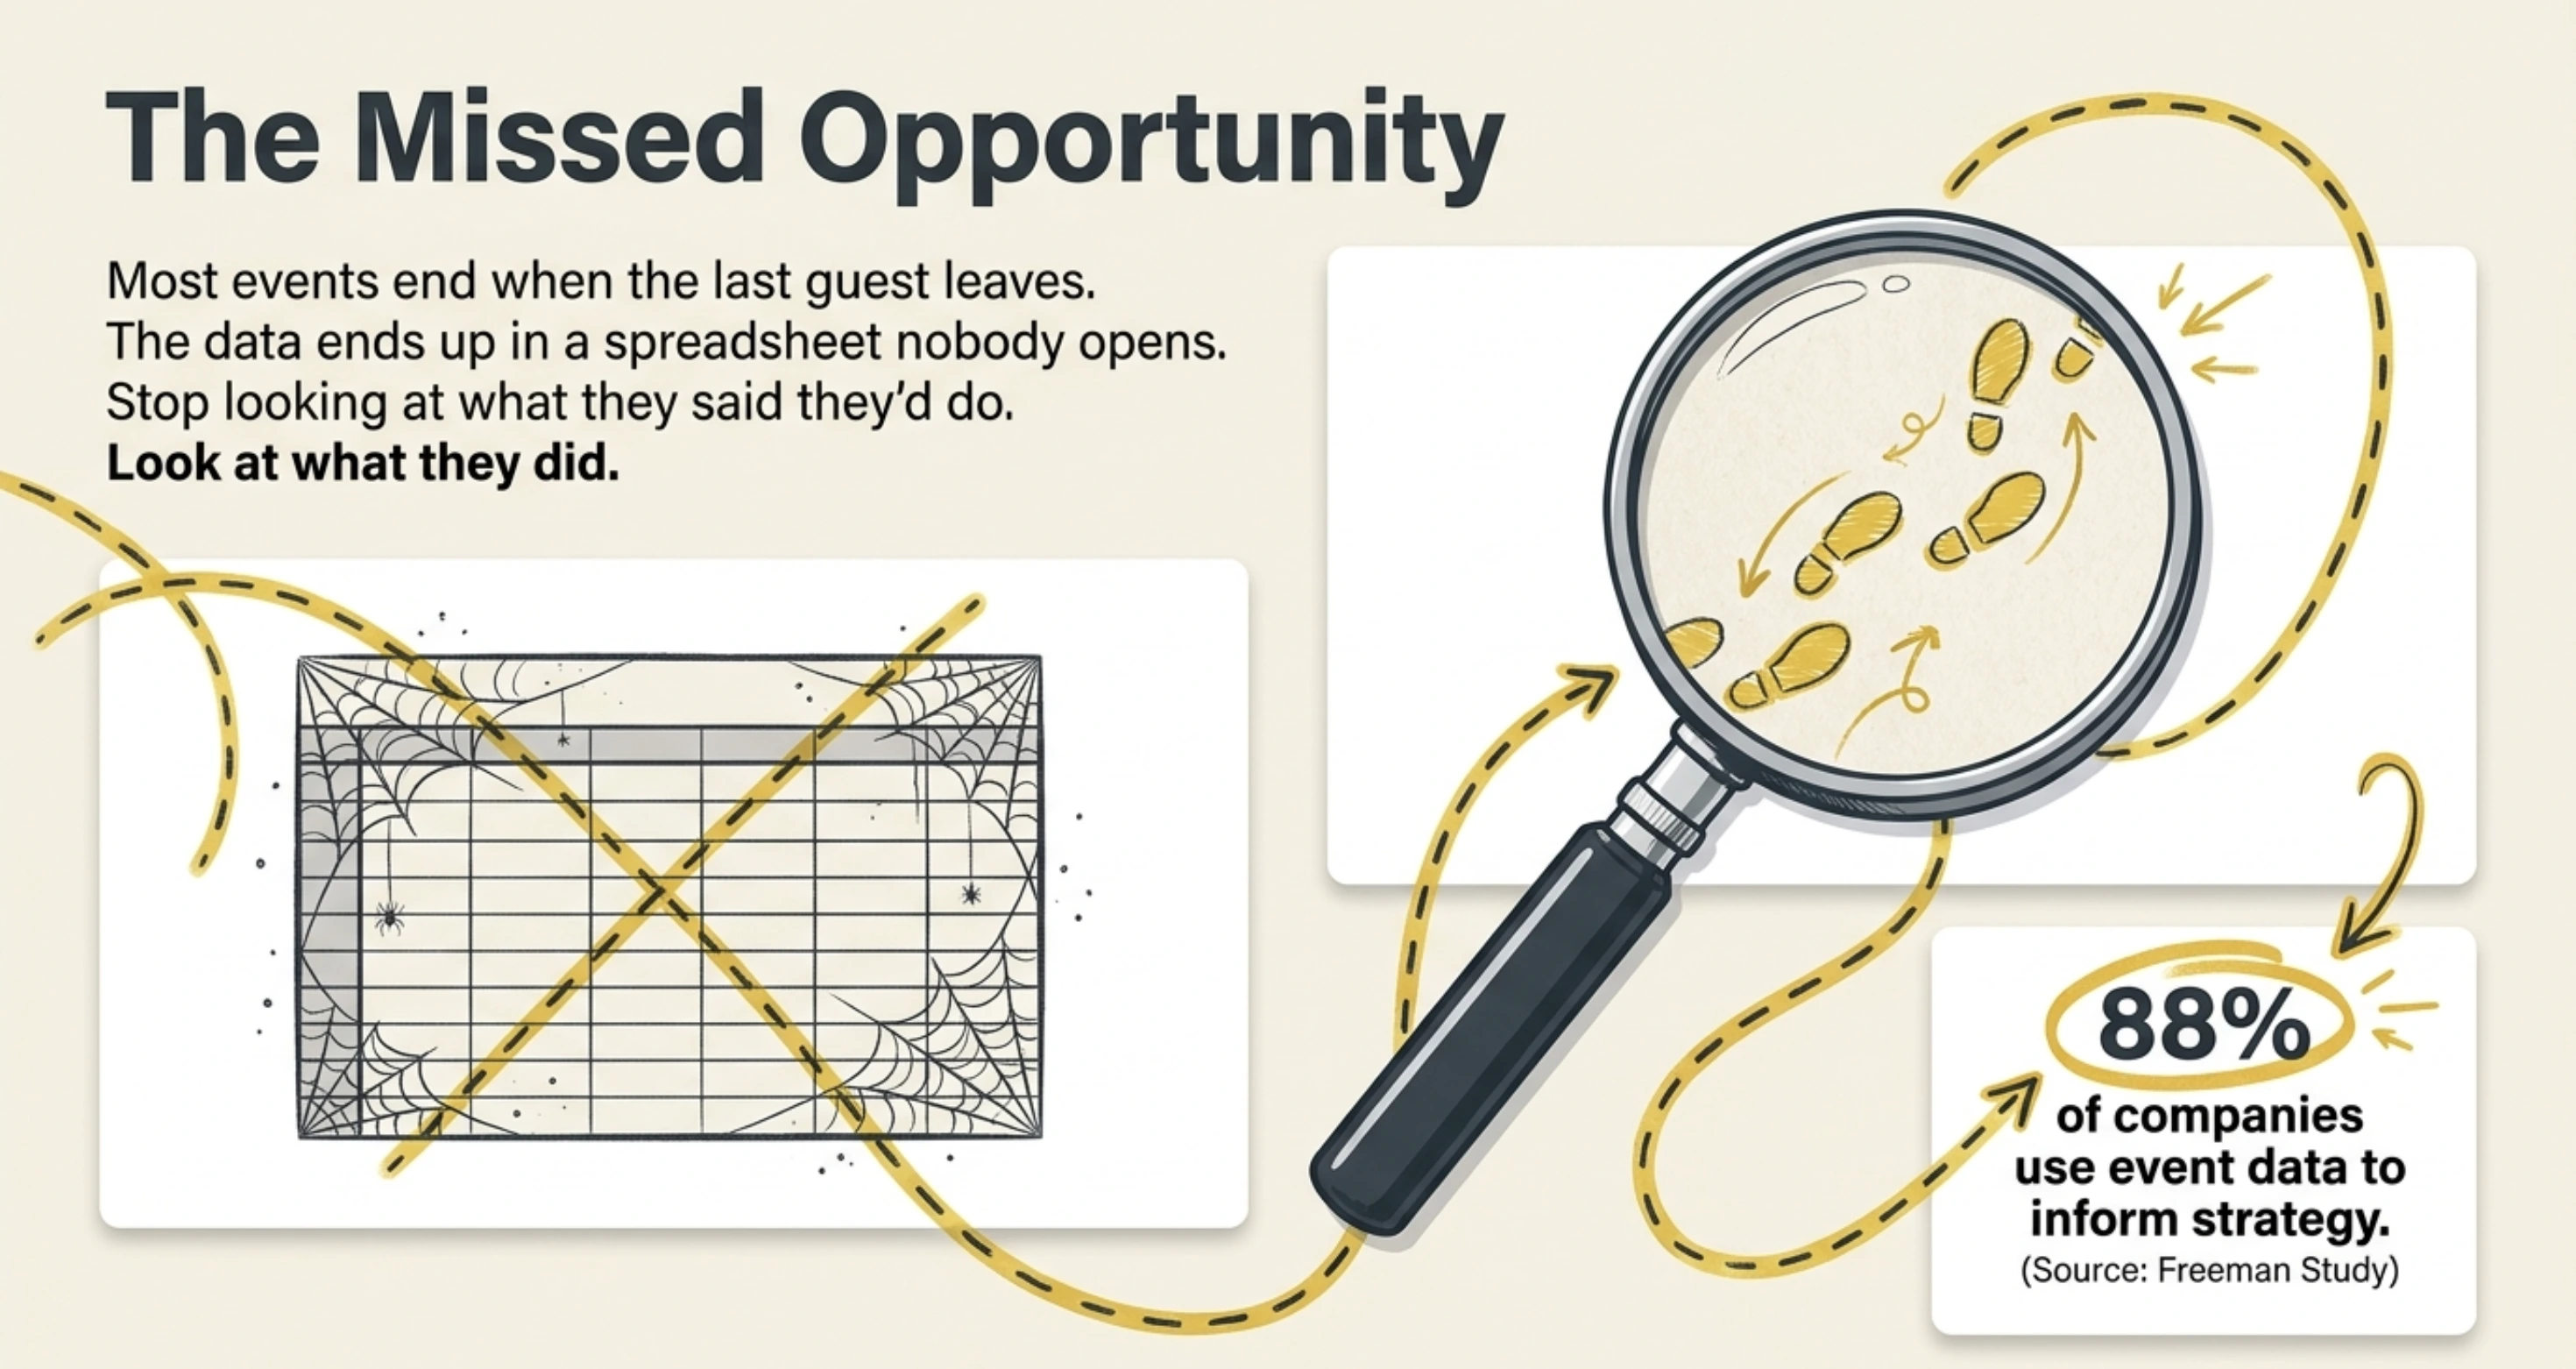
Most events end the moment the last guest leaves, and the data they generated ends up in a spreadsheet nobody opens again. That is a missed opportunity.
To analyze user behavior data from an event, you read the trail attendees leave (how they register, show up, engage, and follow up) and compare it against the goal you set before the doors opened.
Did You Know? Around
88% of companies use event data to inform their marketing strategies and decision-making, highlighting how event insights have become essential for measuring ROI and improving future events. Source:
Freeman Study Industry Research.
When most attendees register and check in from a phone, nearly every action they take is already logged. The hard part is not collecting the data, it is knowing which signals matter and reading them in the right order.
Done well, the analysis surfaces patterns: where people hesitate, what they ignore, and what makes them come back. Those patterns tell you what to keep and what to fix for the next event, instead of guessing.
In this guide, I'll dive deep into what counts as behavior data, what to collect, a repeatable step-by-step method, and how the analysis shifts across ten common event types, from webinars to trade shows.
What is user behavior data from an event?
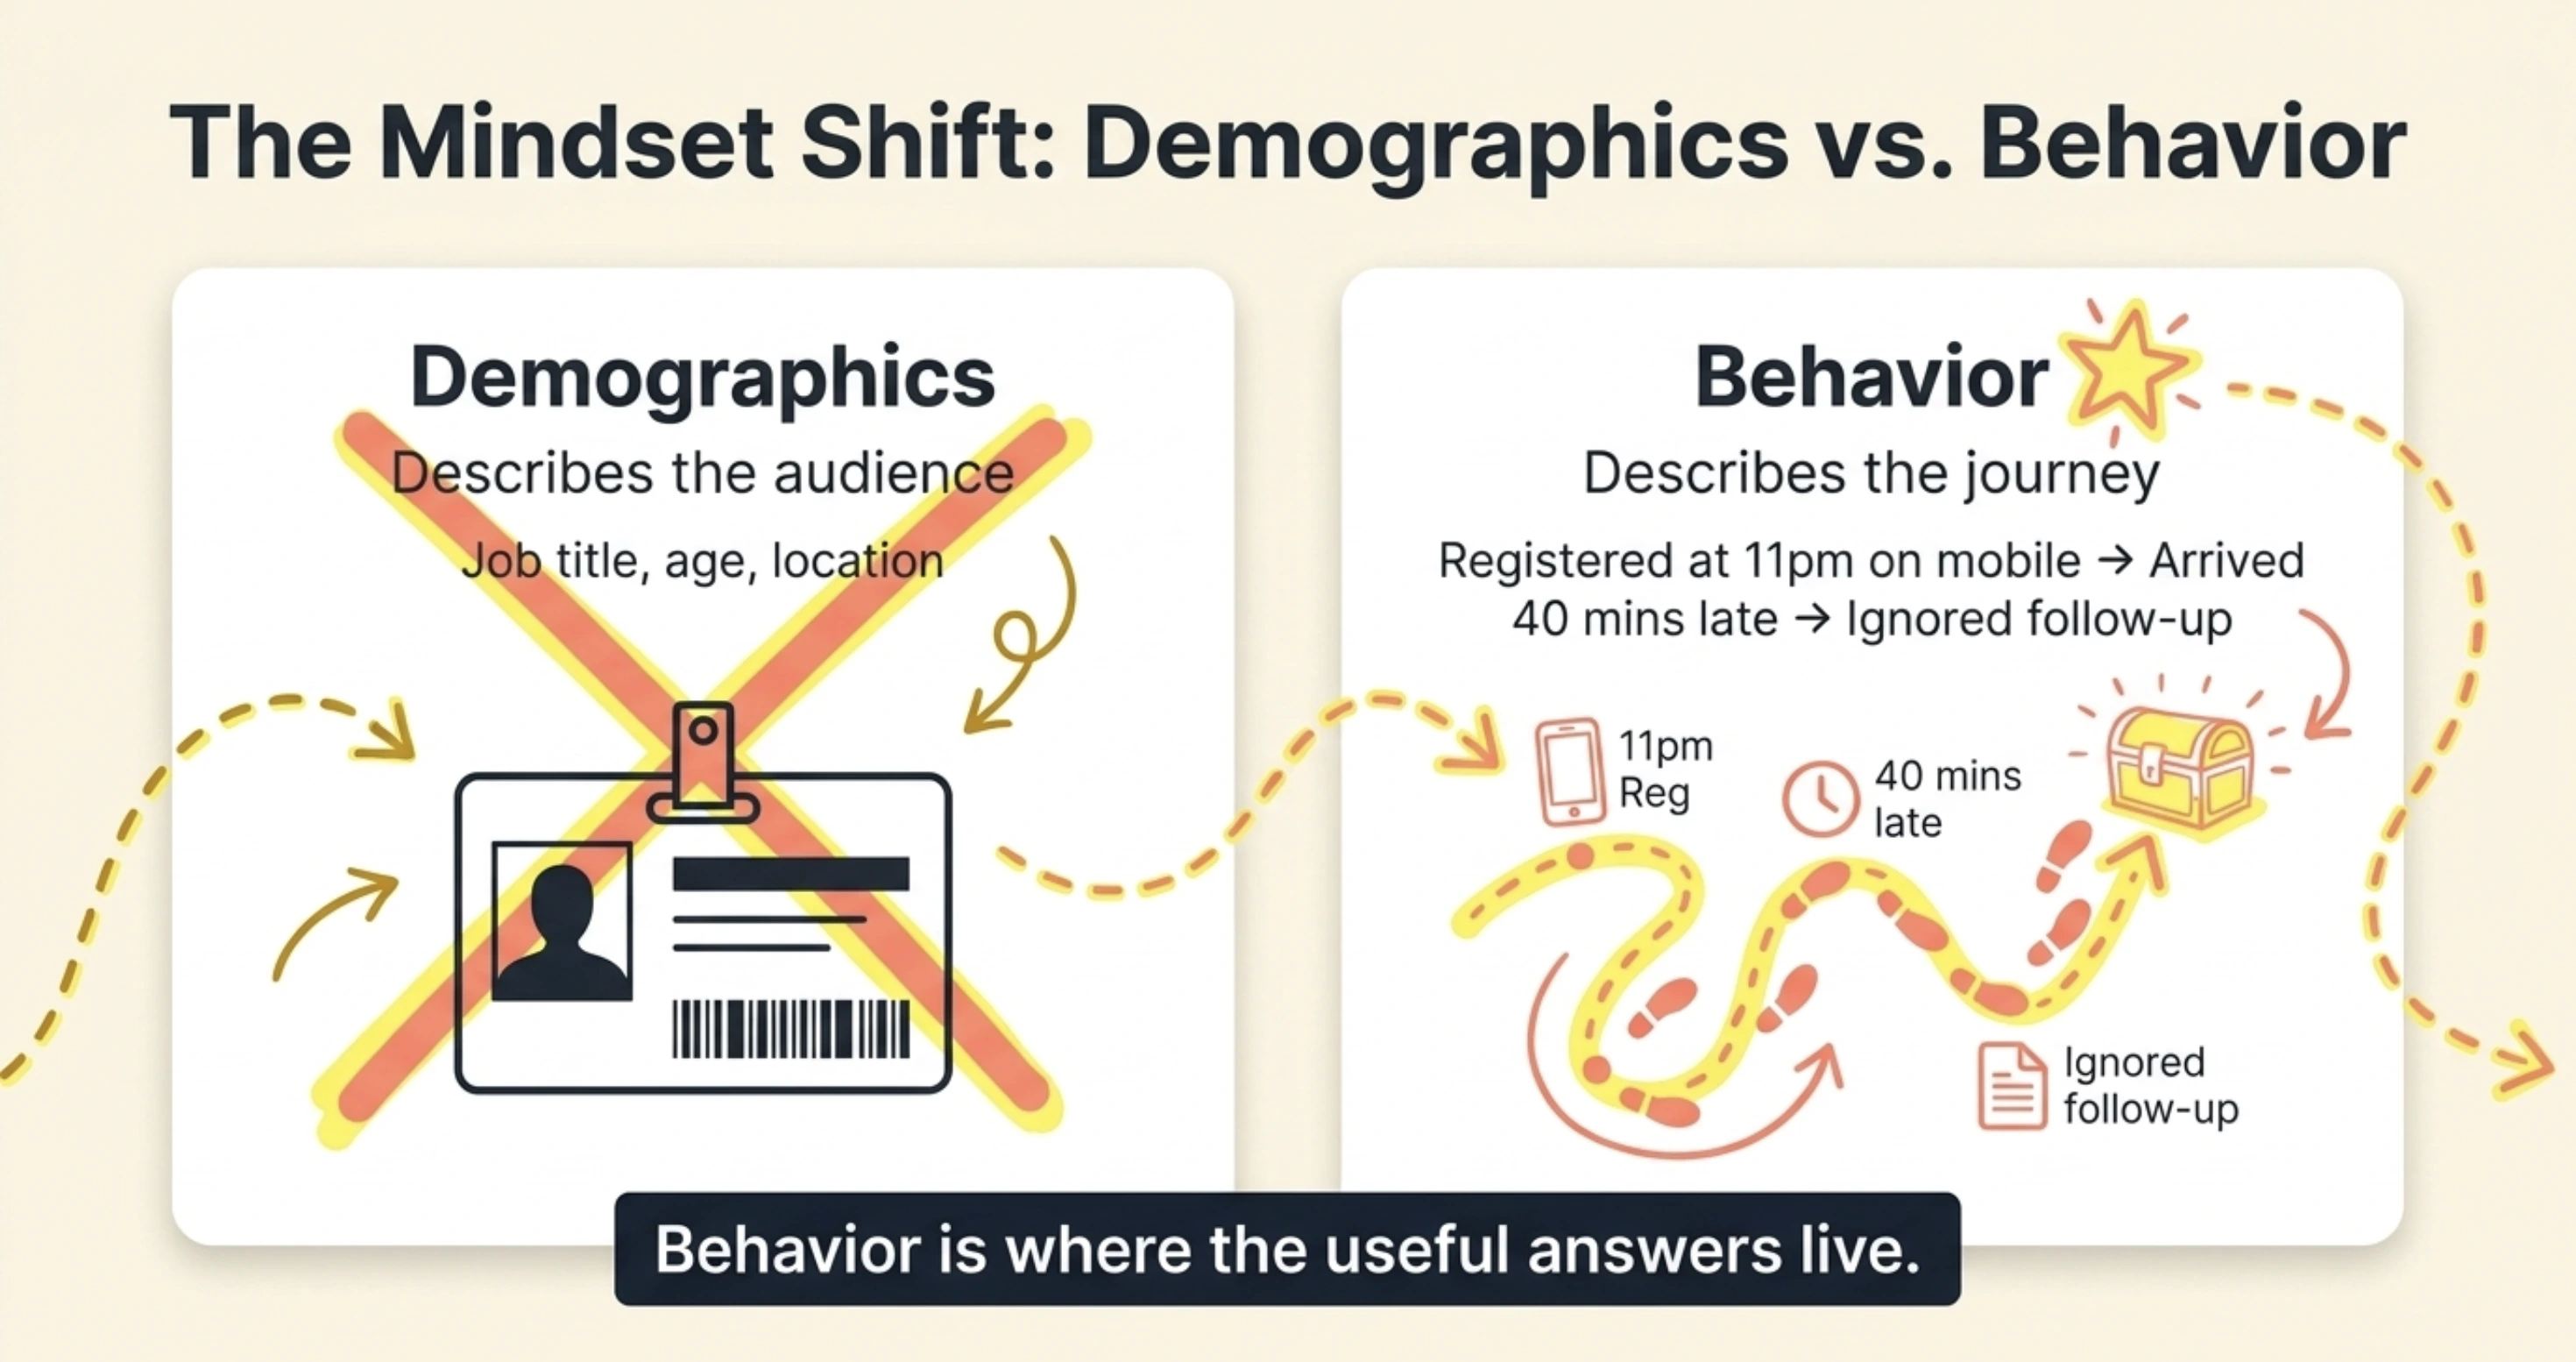
User behavior data from an event is the record of what attendees actually do, across every stage, from the first page visit to the post-event reply. It is different from demographic data, which only tells you who someone is.
Demographics describe the audience. Behavior describes the journey. A registrant's job title is demographic; the fact that they registered at 11pm on mobile, skipped the optional fields, checked in 40 minutes late, and never opened your follow-up email, that is behavior. Behavior is where the useful answers live.
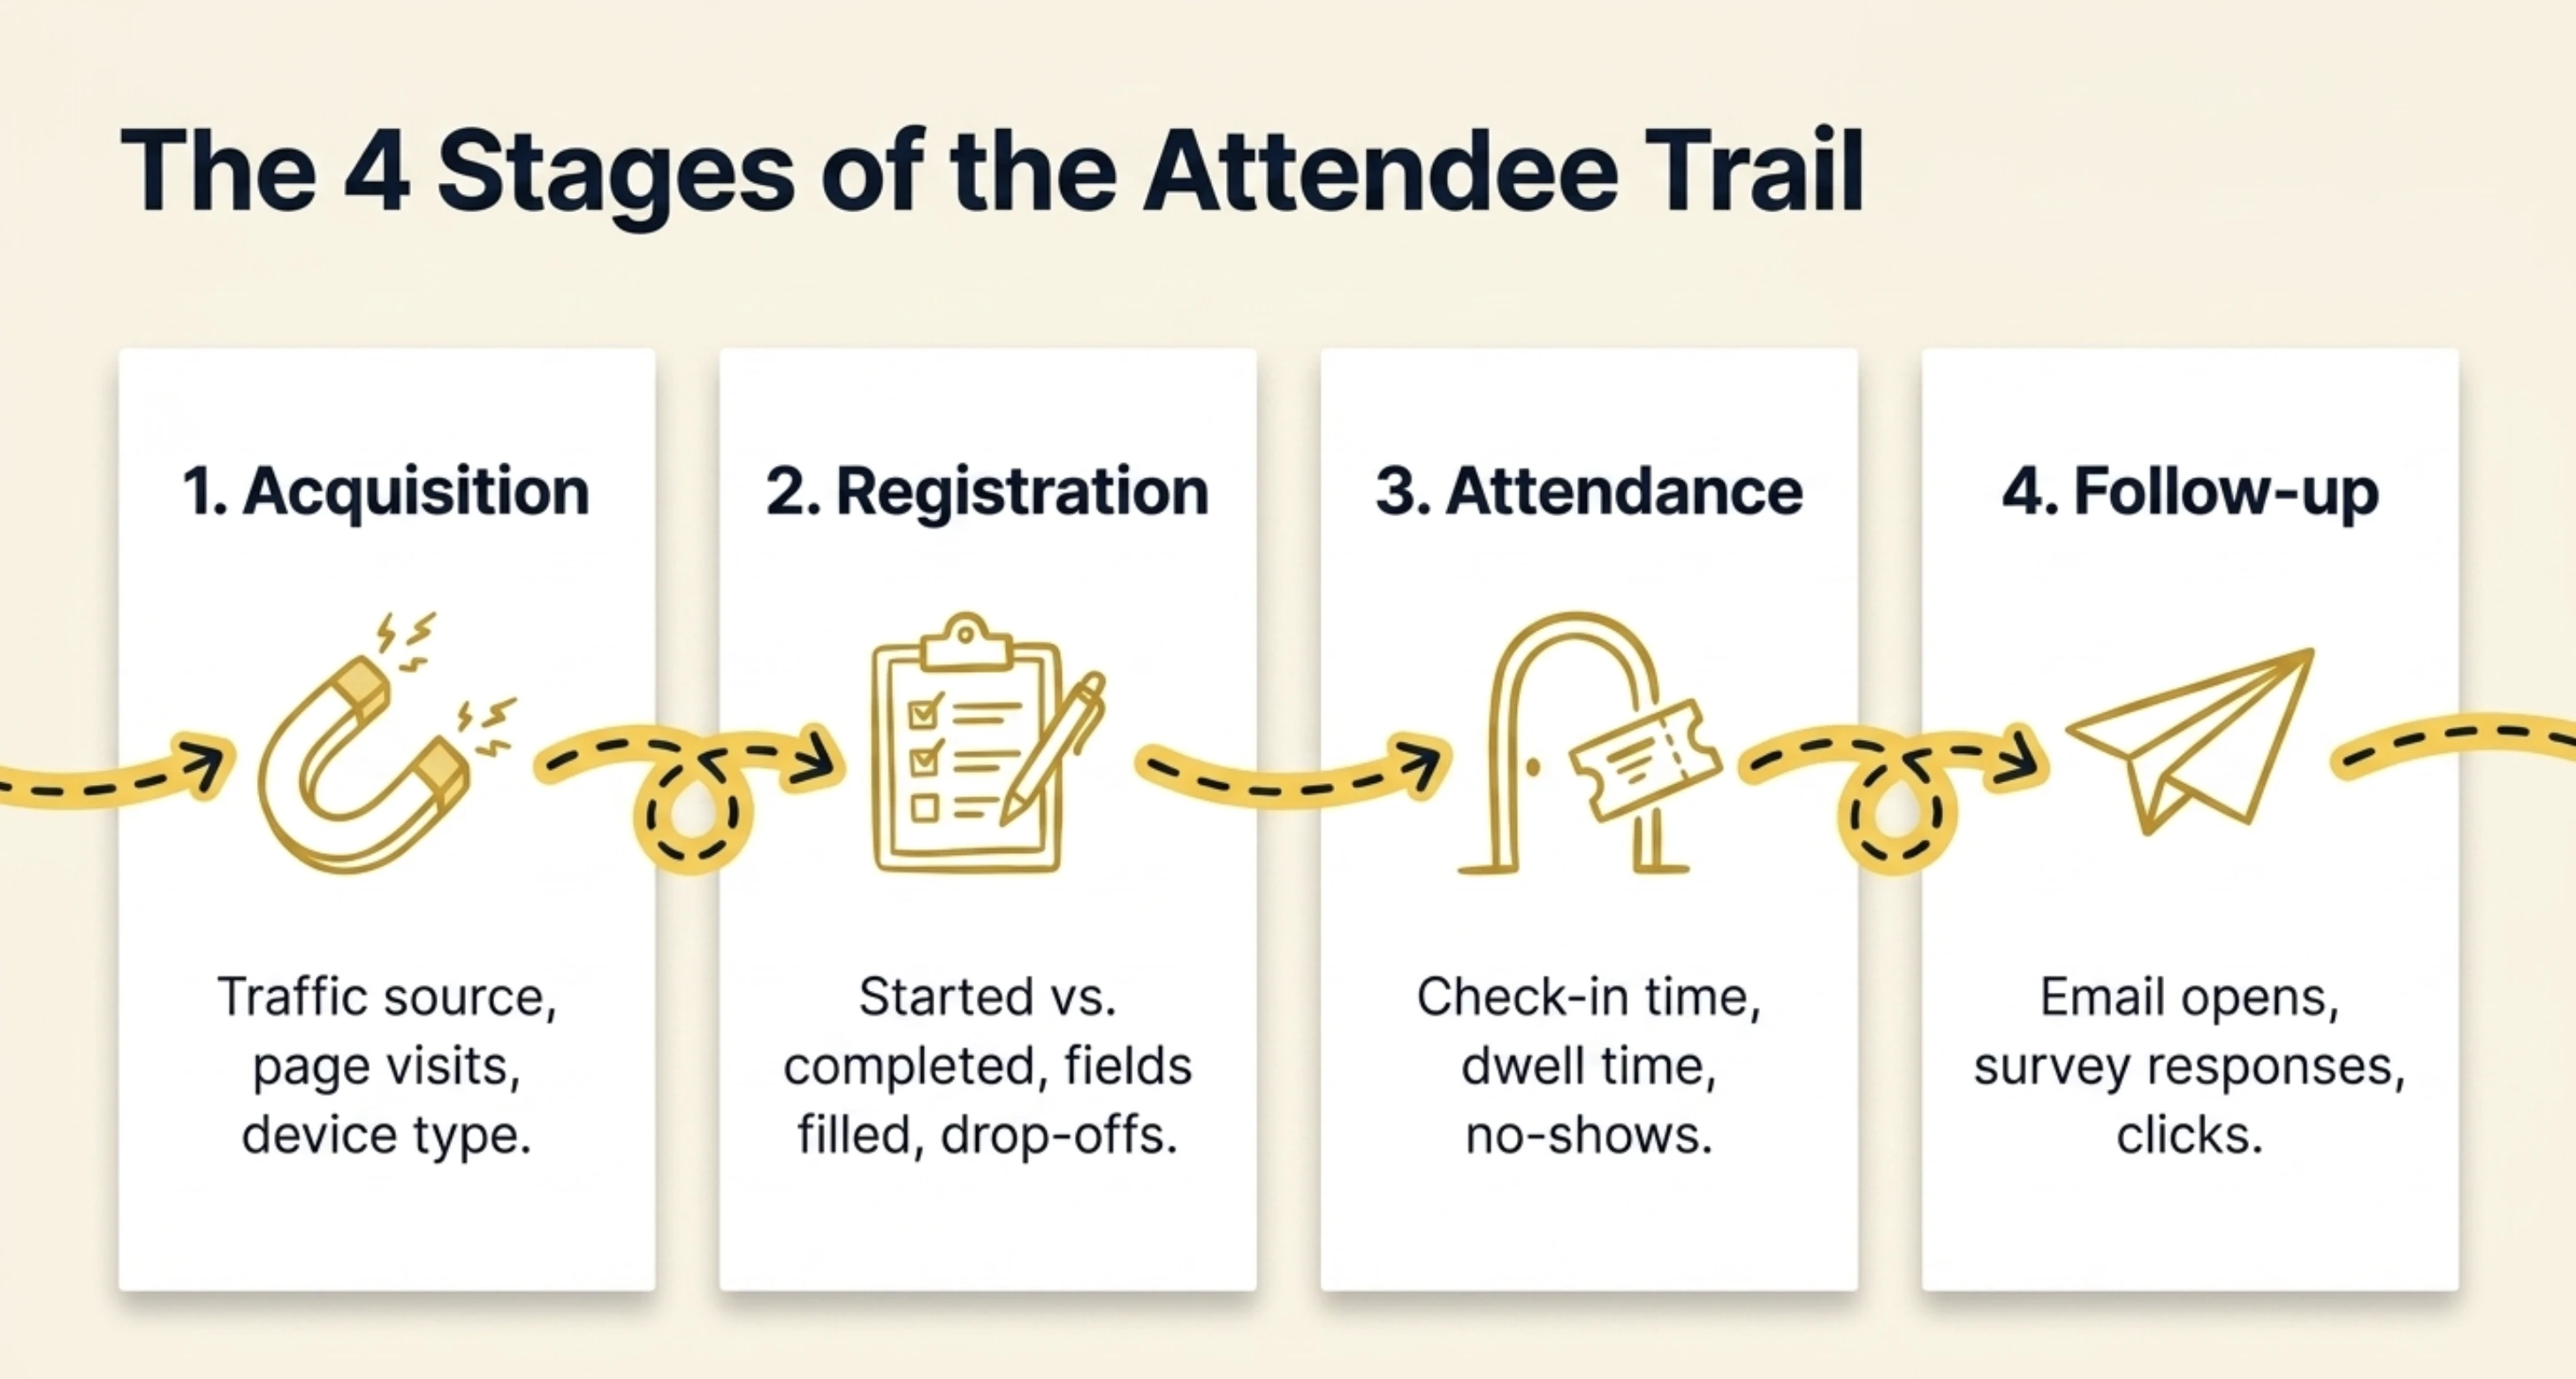
Most event behavior data falls into four buckets:
Acquisition behavior: How people found and reached your event page, from which channel and device.
Registration behavior: Who signed up, who started but abandoned, and what they filled in.
On-the-day behavior: Who checked in, when, and which sessions, booths, or activities they engaged with.
Follow-up behavior: Who opened the thank-you email, answered the survey, or converted afterward.
Why does analyzing event behavior data matter?
Because behavior data is the only honest measure of whether your event worked. Registrations show interest; behavior shows result and the gap between the two is usually where your budget leaks.
Registration funnels drop people for the same reasons checkout pages do. According to the Baymard Institute, 48% of online shoppers abandon a purchase when extra costs feel too high. The single biggest reason for drop-off in its February 2024 survey. Your sign-up flow leaks the same way: a confusing form, a surprise fee, or one field too many, and the registration never completes.
Analysis matters because it answers the questions leadership actually asks. Should we run this again? Which channel was worth the spend? Why did 40% of registrants never show up? Without behavior data, those answers are opinions. With it, they are evidence.
Pro Tip: Track page visits and registrations together, not separately. Ticket Generator reports page visits, total registrations, and conversion rate in one view, so you can see how many visitors actually became registrants, the first leak most organizers miss.
What user behavior data should you collect from an event?
The four most important stages to collect signals across are acquisition, registration, attendance, and follow-up. It's important to note that the user behavior only makes sense as a journey and not as a single number. A big registration count means nothing if you cannot see what happened before or after it.
Here is the practical checklist of what to capture at each stage and why it matters:
Stage
What to collect
What it tells you
Acquisition
Traffic source, page visits, device type, time on page
Which channels and messages actually bring people in
Registration
Started vs completed, fields filled, ticket type chosen, drop-off point
Where friction lives and how your audience self-segments
Attendance
Check-in time, no-shows, sessions or booths visited, re-entries, dwell time
Real engagement versus stated intent
Follow-up
Email opens, survey responses, link clicks, repeat purchases or conversions
Whether the event left a lasting impression
The richest source is often your own registration form. Custom fields let you capture intent at sign-up. Questions like “first event or returning?”and “what do you most want from today?” becomes your segmenting data later. Pair that with structured post-event survey questions and you can connect what people expected to what they actually did.
Set Up Event Ticketing and Distribution in Minutes!
First 10 tickets free | Free account | No credit card required
How do you analyze user behavior data from an event, step by step?
You can analyze event behavior data in seven steps: set a question, centralize the data, clean it, segment your audience, map the attendee journey, find the drop-off points, and turn each finding into one action. The order matters because most failed analyses skip straight to charts without a question.
Start with one question. Decide what you actually want to learn before you open a single report. “Why did 40% of registrants not show up?” beats “let us see the numbers.”
Centralize the data. Pull registration, check-in, and survey data into one place. Patterns hide when the numbers are scattered across five exports.
Clean and standardize. Remove test entries, duplicates, and bot sign-ups, and fix time zones so check-in times line up across regions.
Segment your audience. Split the data by ticket type, traffic source, first-timer versus returning, and region. Averages lie; segments tell the truth.
Map the attendee journey. Build a simple funnel: page visit → registration → check-in → engagement → follow-up. Each step has its own conversion rate.
Find the drop-off points. The biggest gap between two funnel steps is your most valuable insight. A 70% page-to-registration rate but a 55% show rate points you straight at the reminder sequence.
Turn findings into action. Every insight should become one concrete change for the next event: a shorter form, an earlier reminder, a different channel. Analysis with no action is just trivia.
Pro Tip: You do not need a data team to build the funnel. Ticket Generator already reports page-visit, registration, conversion, approval, and attendance rates side by side. This means that the attendee journey is already half-mapped even before you export anything.
How does event behavior analysis change by event type?
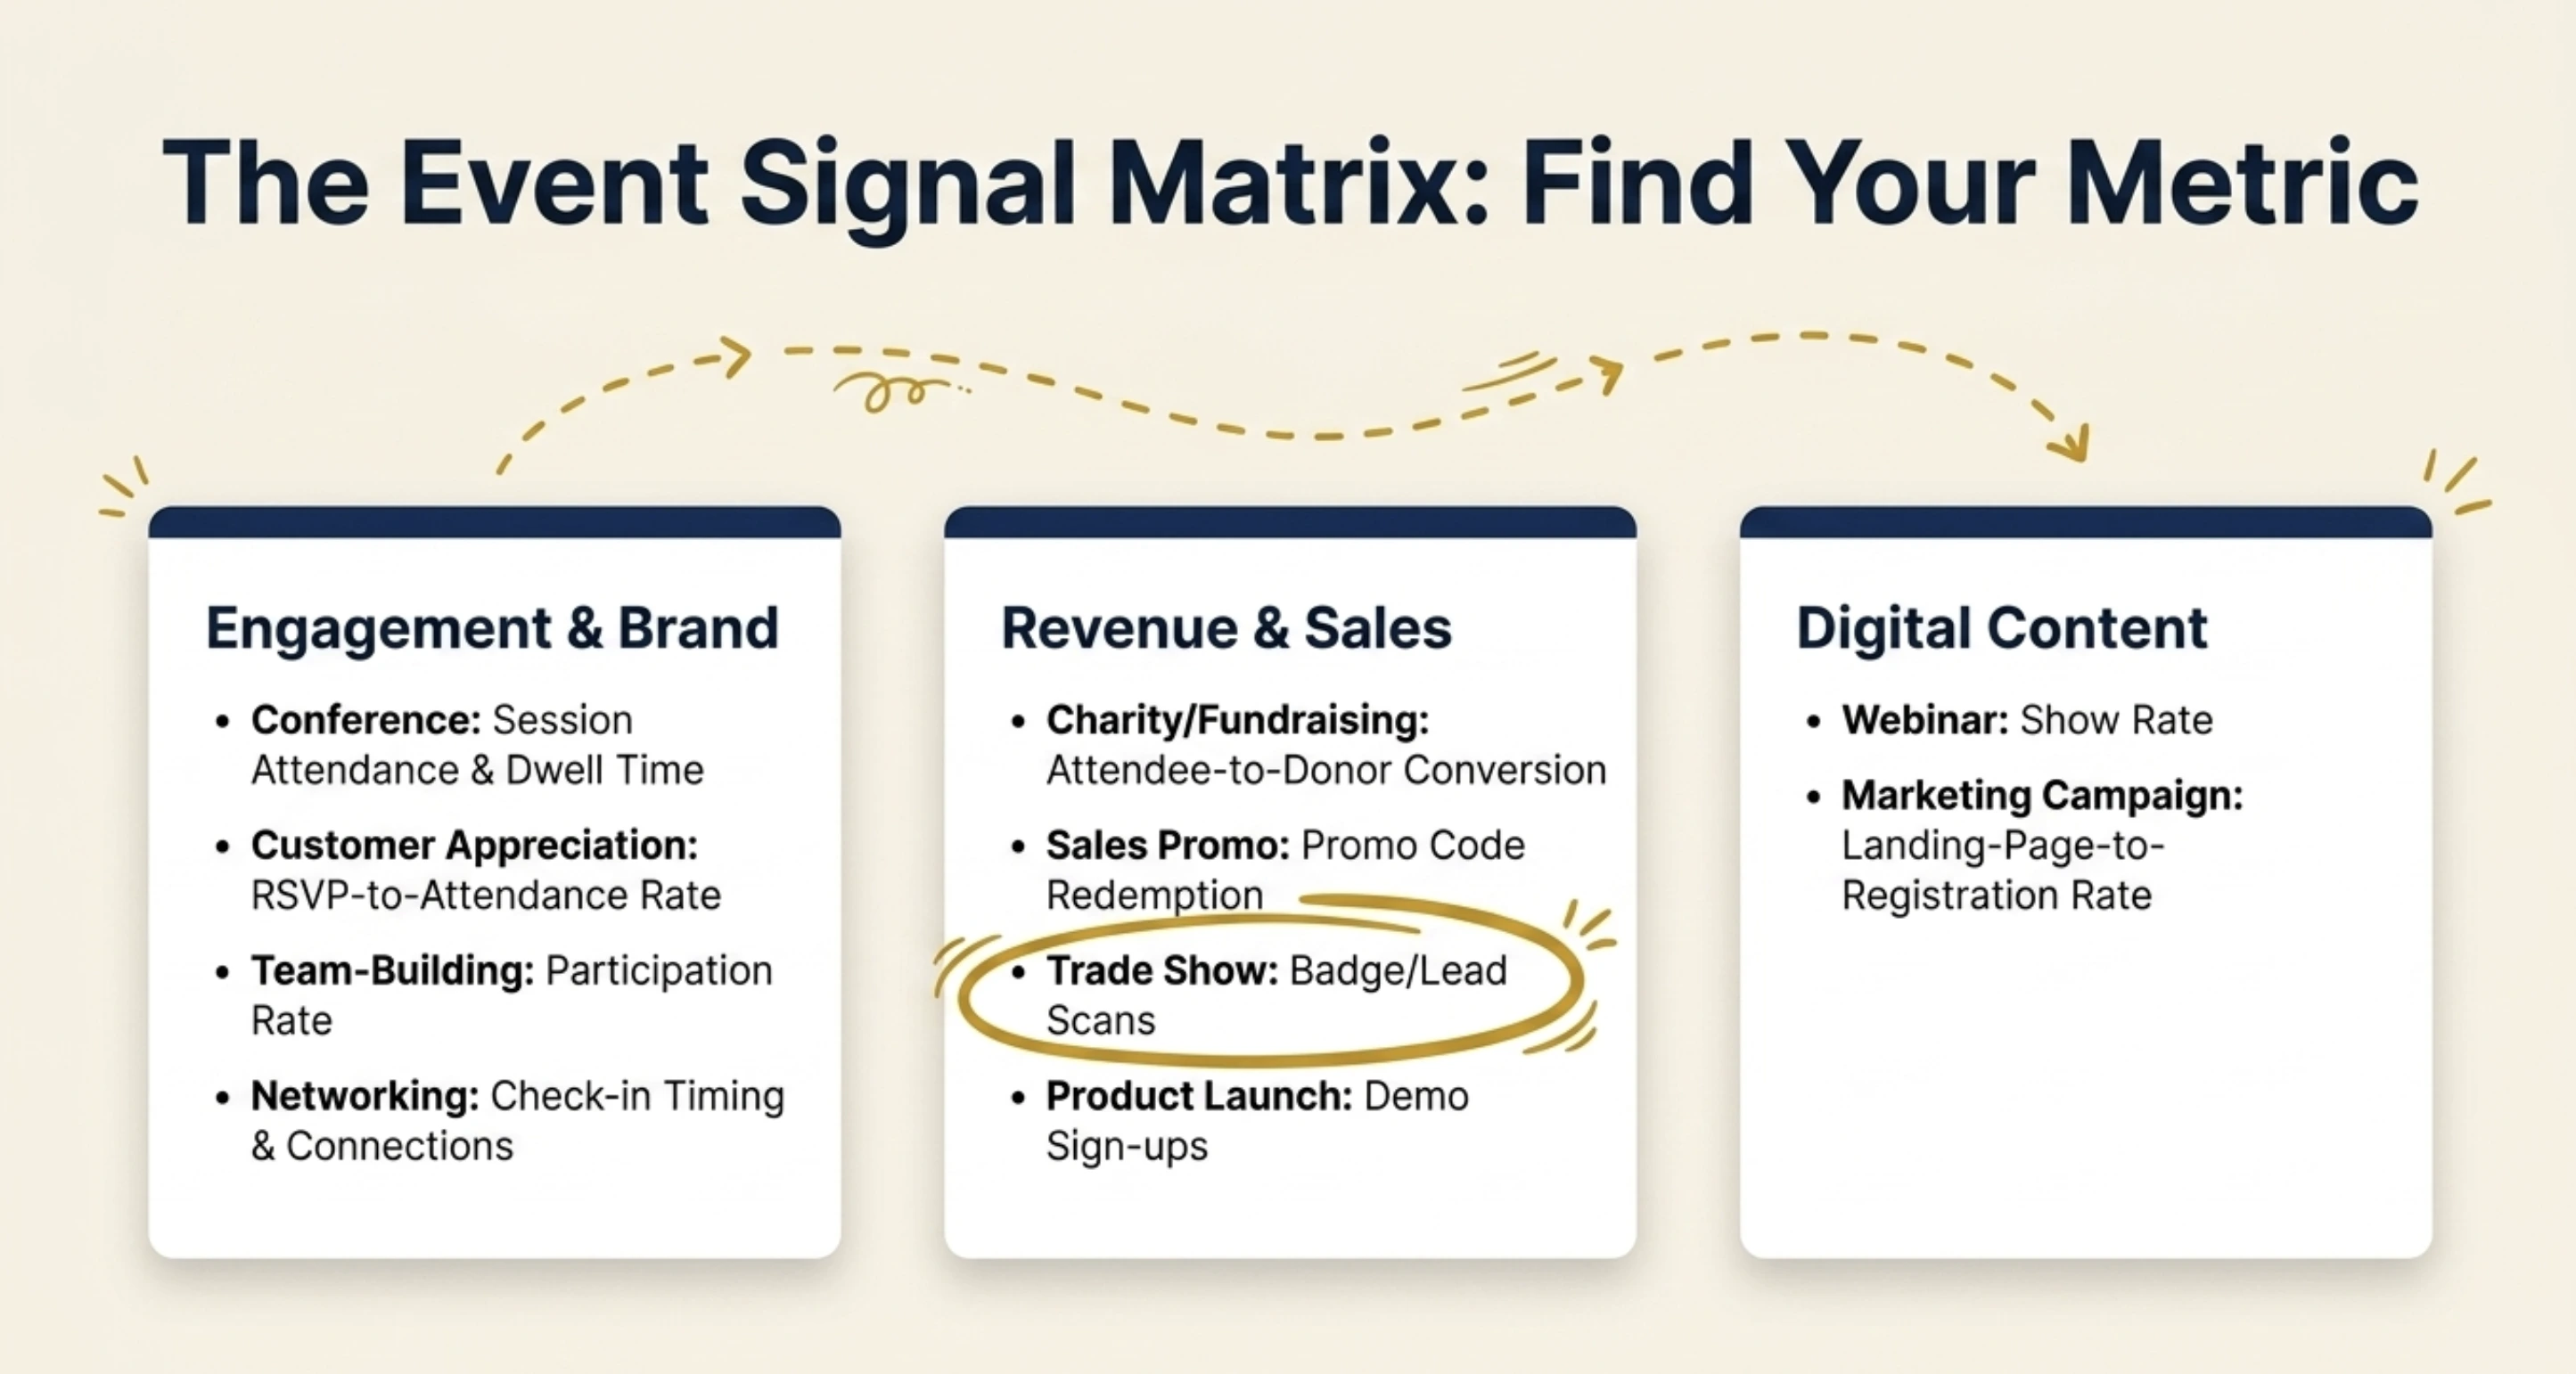
The framework stays the same mostly, but the one or two signals that matter most change with the event's goal. A webinar lives or dies on its show rate; a trade show on qualified lead scans; a fundraiser on dollars raised per attendee. Match the signal to the purpose.
Use this table to find the behavior signal to read first for the ten common event types:
Event type
Behavior signal to watch first
What it reveals
Charity / fundraising event
Attendee-to-donor conversion, average gift, repeat donors
Whether the event raised money and built a giving base
Conference
Session attendance and drop-off, track popularity, dwell time
Which content to keep, cut, or reschedule next year
Engagement and morale, not just bodies in the room
Trade show
Booth visits, badge or lead scans, dwell time, scan-to-follow-up
Lead quality and which booth tactics work
Webinar
Registration-to-attendance (show rate), watch time, poll and Q&A activity
Content relevance and where attention fades
Notice the pattern: a high registration count means nothing on its own. For a webinar, it is the show rate; for a trade show, it is the lead scans; for a fundraiser, it is the dollars per guest. Pick the signal that maps to your goal, then read everything else against it.
What mistakes should you avoid when reading event data?
The most common mistake is celebrating vanity metrics, big registration numbers, while ignoring the behavior that shows whether the event actually worked. A few traps catch almost everyone:
Reporting registrations instead of attendance. Sign-ups are intent; check-ins are reality. No-shows are the most honest signal you have.
Reading only averages. “Average dwell time: 42 minutes” can hide two groups who stayed five minutes and ninety. Always segment.
Collecting data with no question. If you do not know what you are looking for, every chart looks fine.
Never closing the loop. The analysis is wasted unless one finding becomes one change next time.
How Ticket Generator helps you analyze event behavior data?
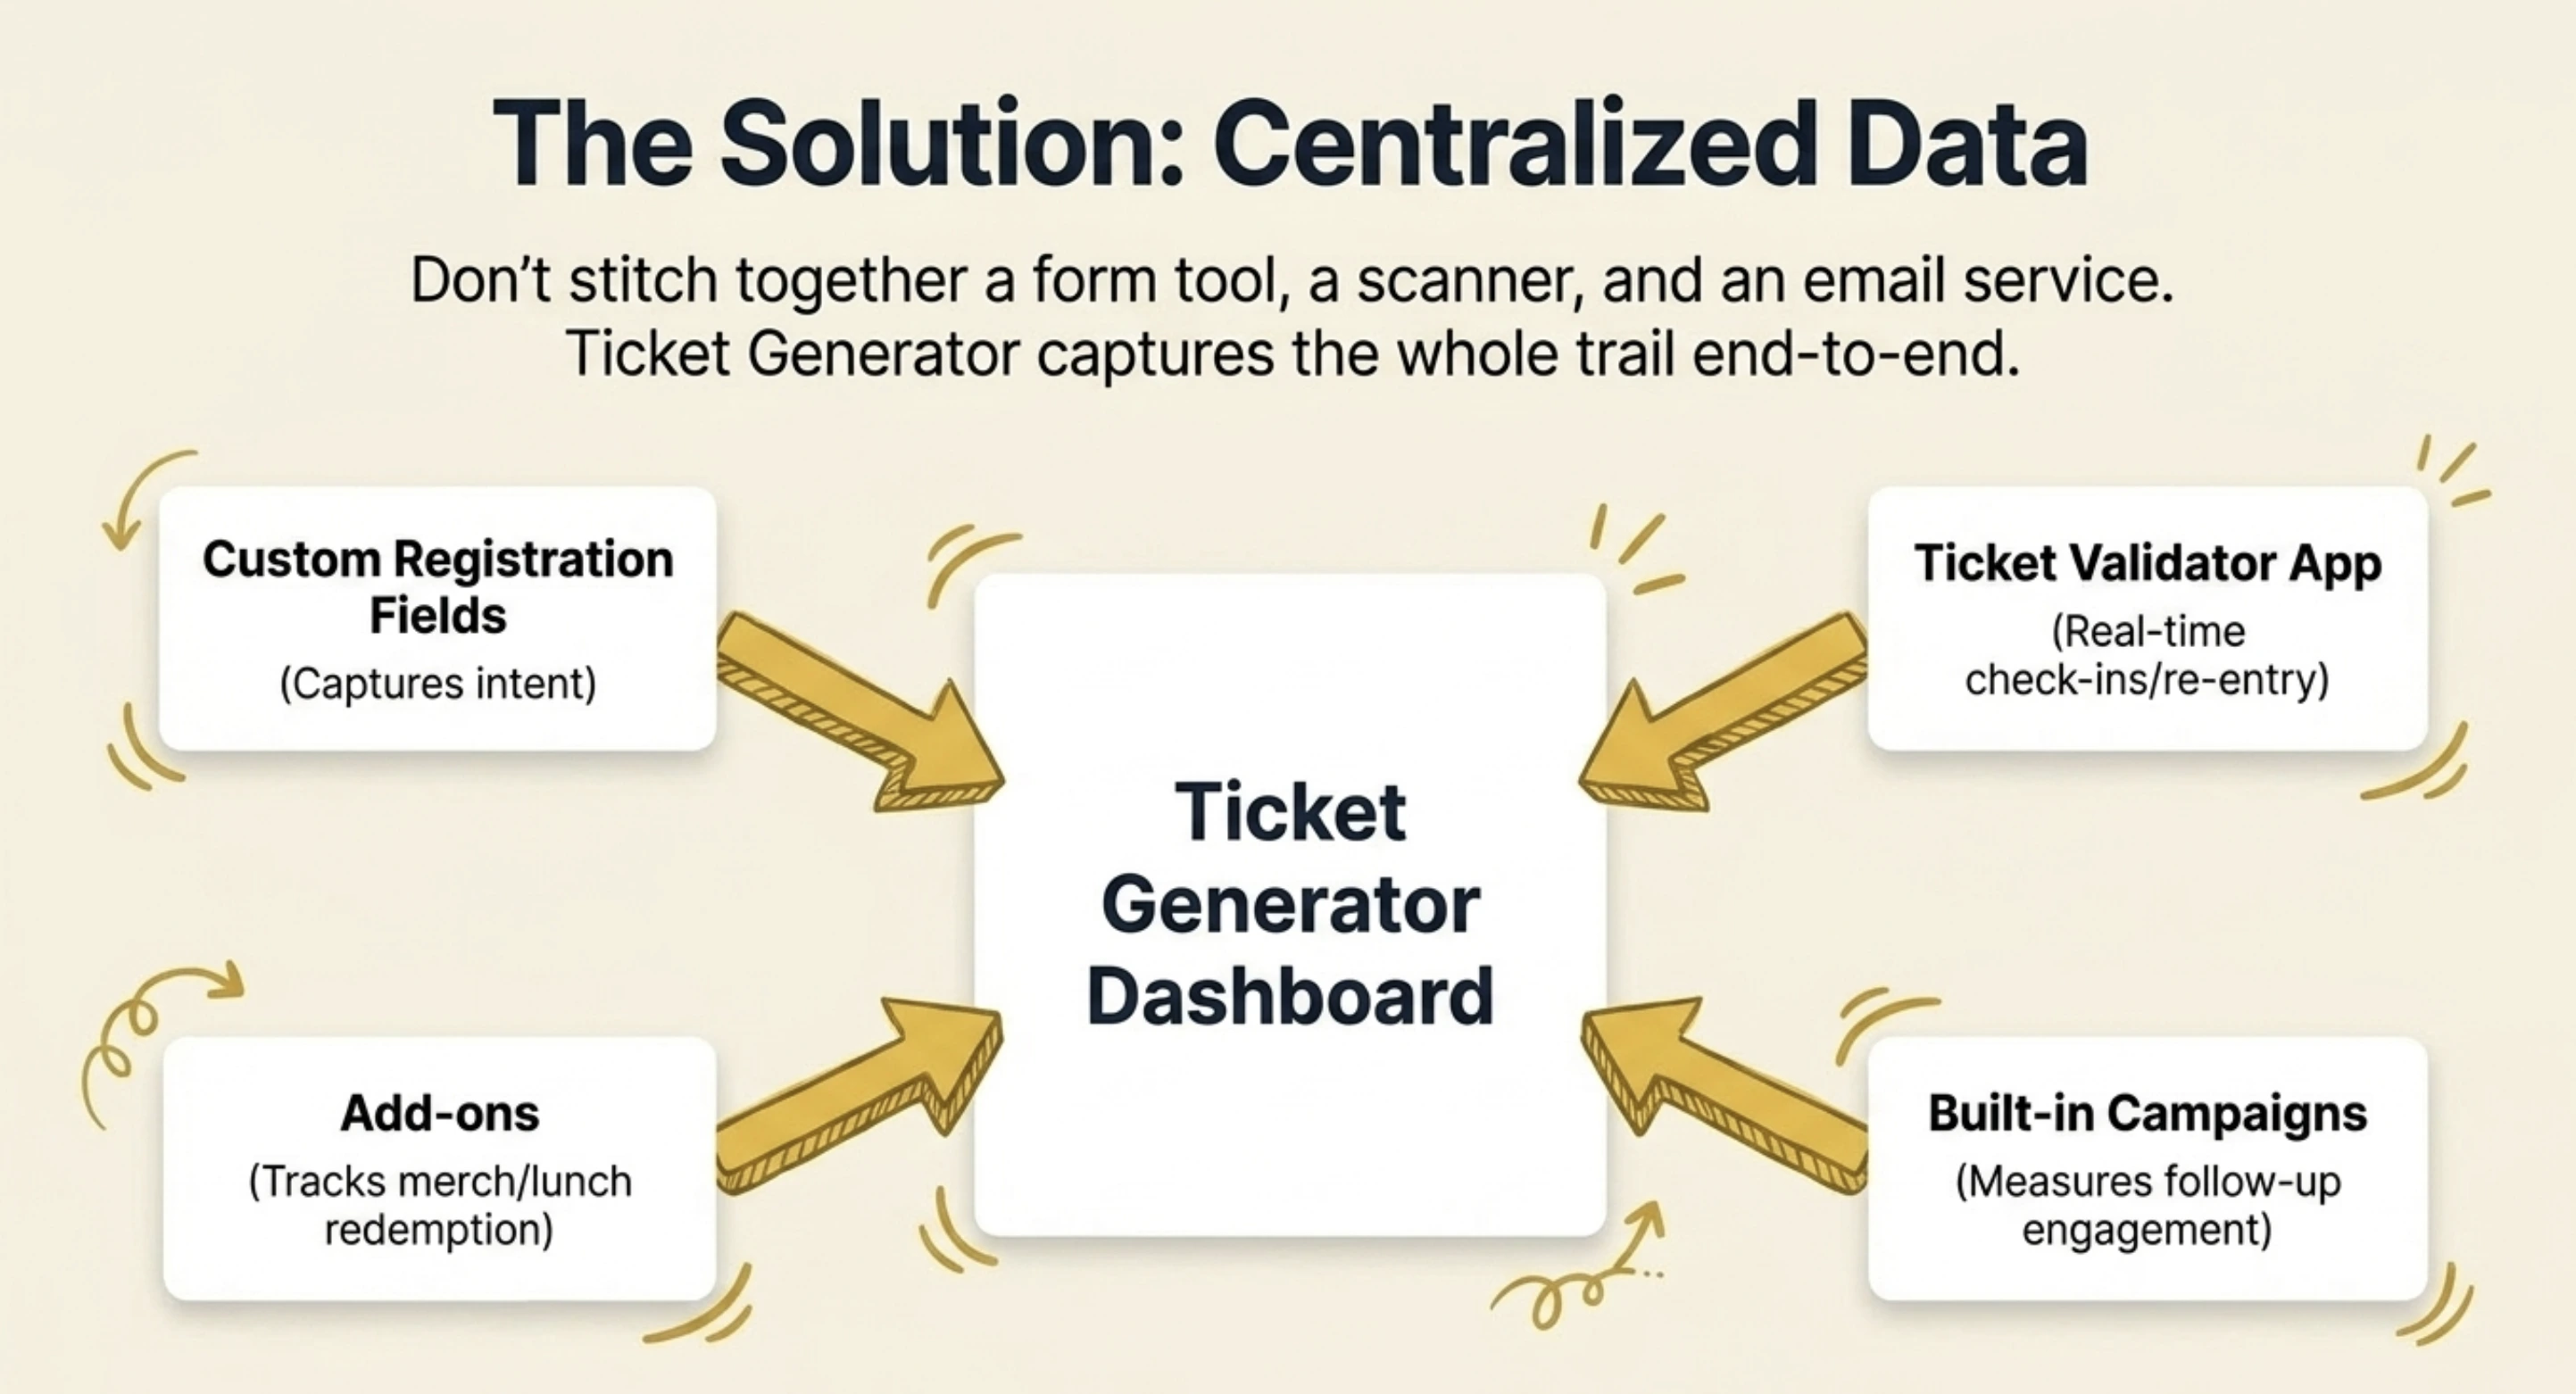
Ticket Generator is built for organizers who want their event data in one place and fully under their control. Because registration, ticketing, check-in, and follow-up all run on the same platform, the attendee journey is captured end to end. You are not stitching together a form tool, a scanner, and an email service after the fact.
For analyzing behavior specifically, a few capabilities do the heavy lifting:
Built-in analytics report total tickets generated, registrations, conversion rate, page visits, approval rate, and attendance rate (your funnel, ready to be read).
Custom registration fields capture intent and segmenting data at sign-up, so you can split behavior by audience later.
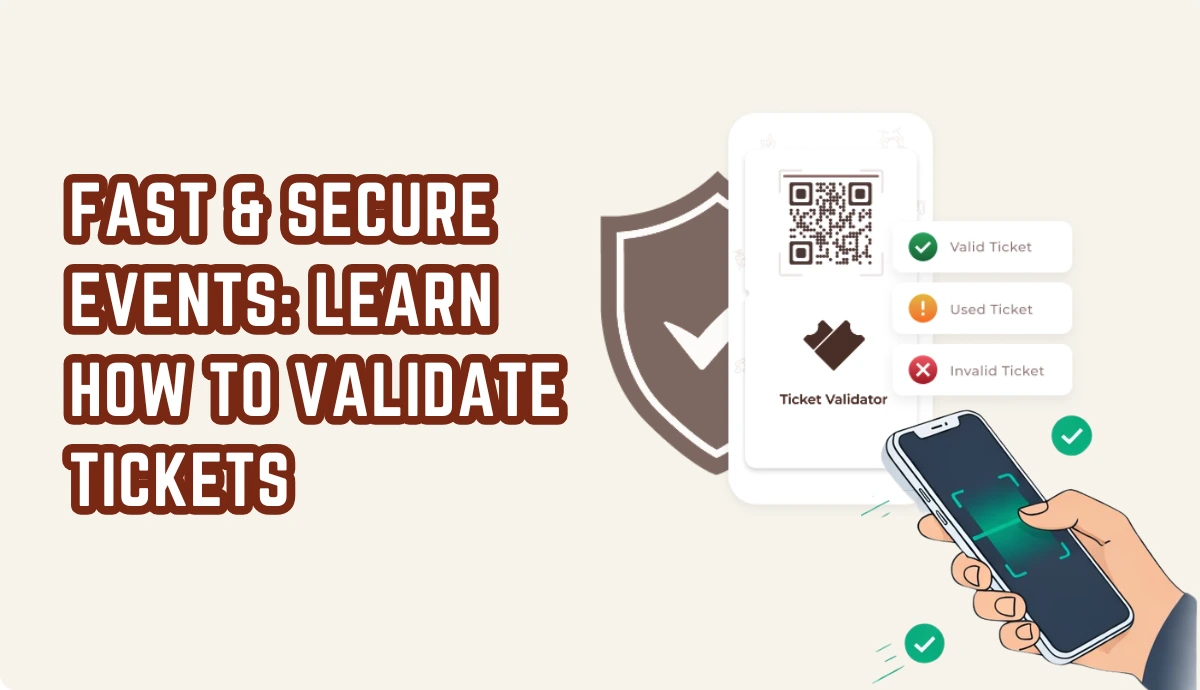
The Ticket Validator app logs check-in times, supports re-entry, and flags duplicates and unauthorized entry, giving you real event attendance tracking instead of a guess at the door.
Add-ons with scannable perks like parking, lunch, or merchandise record redemption data, which is gold for sales promotions and upsell analysis.
Built-in Campaigns track email and engagement performance, so follow-up behavior is measured, not assumed.
Exports and integrations with which you can download everything as Excel or PDF, or pipe it to Google Analytics, Zapier, or the REST API for deeper analysis.
It works at scale, too. Felipe Motta, a food-and-beverage brand in Panama, ran its events through Ticket Generator with 638+ tickets and a 96% maximum attendance rate, 95% of them generated through the API. This is exactly the kind of clean, connected data that makes behavior analysis fast. Across the platform, Ticket Generator has powered 1,000,000+ tickets and 30,000+ events in 100+ countries.
And because pricing is credit-based with zero commission and payments going straight to your own gateway, your attendee data stays yours. It is not locked inside a marketplace (which is the case for most ticketing tools in the industry). When the event ends, you can create a clear event report from data you actually own, or dig deeper with full event tracking across recurring events.
Set Up Event Ticketing and Distribution in Minutes!
First 10 tickets free | Free account | No credit card required
Reading attendee behavior well is less about fancy dashboards and more about asking one clear question, then following the attendee journey until the answer appears. Registrations tell you who was interested; behavior tells you what actually happened and that is the difference between repeating a guess and improving on evidence.
Not every event needs the same signal. A webinar's show rate, a trade show's lead scans, and a fundraiser's dollars per guest each point at a different truth. Pick the one that maps to your goal, segment honestly, and close the loop with a single change for next time. When your ticketing, check-in, and follow-up all live in one platform, that loop takes minutes instead of days.
Try Ticket Generator to capture every registration, check-in, and conversion in one dashboard, then export the data and let your next event start where this one left off. Your event. Your data. Your decisions.
FAQs: Analyzing User Behavior Data From an Event
1. What is user behavior data from an event?
User behavior data from an event is the record of what attendees actually do across the event journey (page visits, registrations, check-in times, session or booth engagement, and follow-up actions). It is distinct from demographic data, which only describes who attendees are. Behavior data is what you analyze to judge whether an event worked.
2. What is the best metric to measure event success?
There is no single best metric. The right one depends on the event's goal. A webinar is measured on show rate and watch time, a trade show on qualified lead scans, a fundraiser on dollars raised per attendee, and a product launch on demo sign-ups and follow-up requests. Choose the signal that maps to your objective, then read the others against it.
3. How do you track attendee behavior at an in-person event?
At in-person events, behavior is tracked mainly through QR check-in scans, badge or lead scans, dwell time, and re-entry data. A tool like Ticket Generator's Ticket Validator app logs each scan in real time, flags duplicates, and records check-in timing, so you can see who showed up, when, and how often, not just who registered.
4. How soon after an event should you analyze the data?
Analyze within 48 to 72 hours, while the context is still fresh and you can interpret odd numbers correctly. Send any survey within 24 hours, since response rates fall sharply after that. Quick analysis also means insights reach the next event's planning while there is still time to act on them.
5. Can you analyze user behavior data from a free event?
Yes. To analyze user behavior data from an event, you do not need ticket sales. Registration completions, check-in times, session engagement, and survey responses all generate behavior data even when entry is free. Free events still reveal where people drop off and what keeps them engaged, which is often the whole point.
Ashish Chandra has spent 5+ years writing about event technology, covering topics such as ticket design, QR check-ins, attendee management, and event marketing strategy. As the Content Lead at Ticket Generator, Ashish has analyzed hundreds of real-world event workflows and ticketing setups, helping organizers across industries use QR-based tickets, event landing pages, and smarter ticketing systems to run smoother, better-attended events.
His writing is shaped by real user needs and the questions organizers ask most often: How do I sell more tickets? How do I avoid chaos at the door? How do I make my next event better than my last?
When he steps away from the screen, you'll likely find him hiking a quiet trail or tending his plants- his preferred way to reset.


.png)